METHOD
The United States Naval Observatory B1.0 Catalog contains information on over a billion objects extracted from sky surveys during the last 50 years. The listings include two estimates of the B and R magnitudes and this project was intended to examine if differences between the two values could be used to identify objects of astronomical significance.
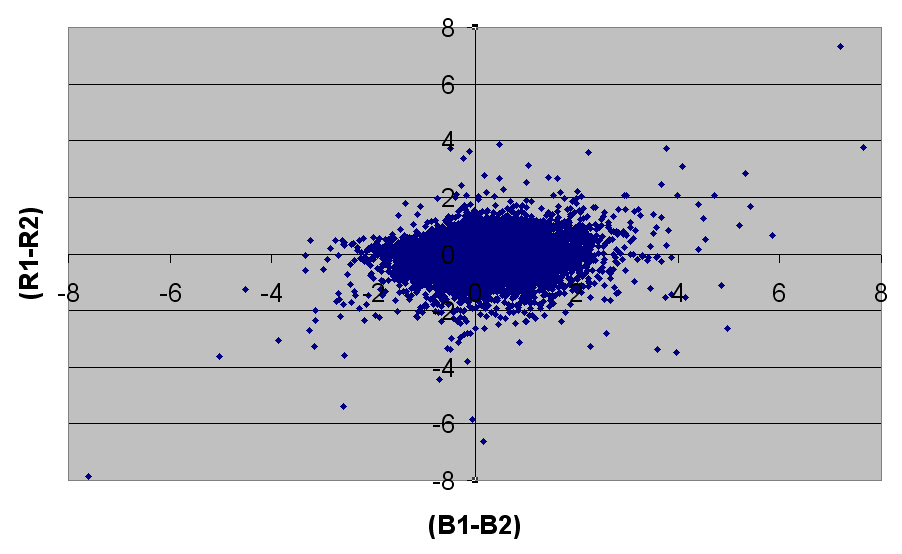
The mean value of (B1-B2), based on a random selection of stars with blue and red magnitudes between 12 and 22 and with a star/galaxy classification of at least 8, is 0.23 with a standard deviation of 0.63. The mean value of (R1-R2) is -0.04 with a standard deviation of 0.42.
When 32000 of these results are plotted graphically- 32000 is the upper limit in Microsoft Excel - it can be seen how rare it is for the two blue or the two red results to be more than four magnitudes apart.
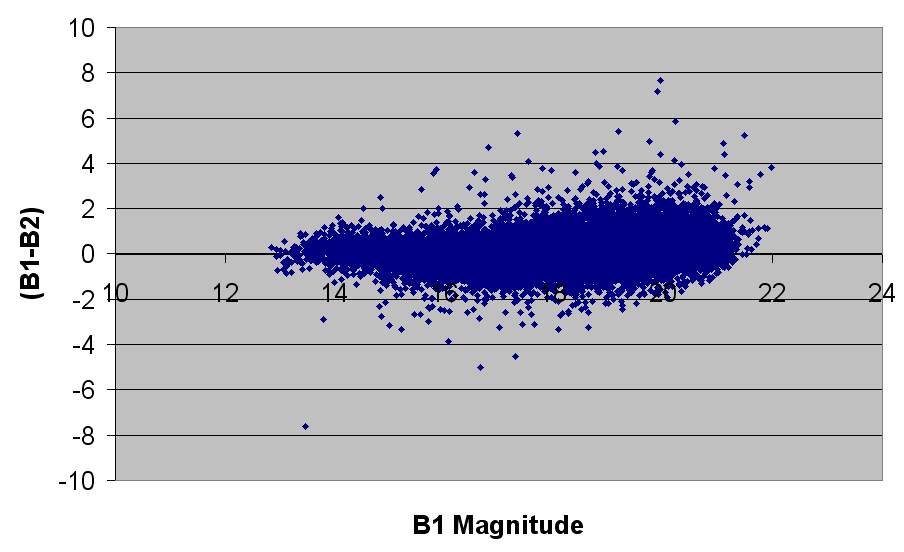
As can be seen there is a clear tendancy for the (B1-B2) value to show more scatter as progressively fainter objects are studied.
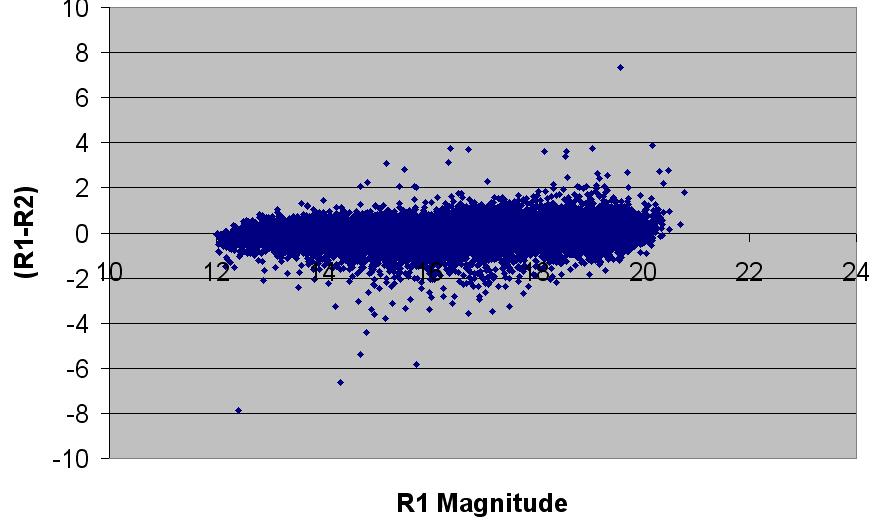
The (R1-R2) shows a similar trend but somewhat less marked.
Download details of stars where abs(B1-B2) > 4
Download details of stars where abs(R1-R2) > 4
I wonder how many of these are geuine variable stars (perhaps Mira's or CV's or Flare Stars) and how many are mis-identifications due to proper motion between the two epochs?
Over the last few years I have carried out many astronomical data mining or data analysis projects. Most remain unpublished and this series of papers aims to put them all into the public domain. I welcome constructive feedback from readers and encourage colleagues to take the work forward, perhaps as far as peer reviewed publication. I can be contacted by email. and this address is monitored daily.
Martin Piers Nicholson - Shropshire, United Kingdom.
This page was last updated on August 5th 2011.